Output
This section describes the main output files of Plasmid Profiler including the heatmap in png and interactive HTML format, and a comma separated value file of all identified plasmids.
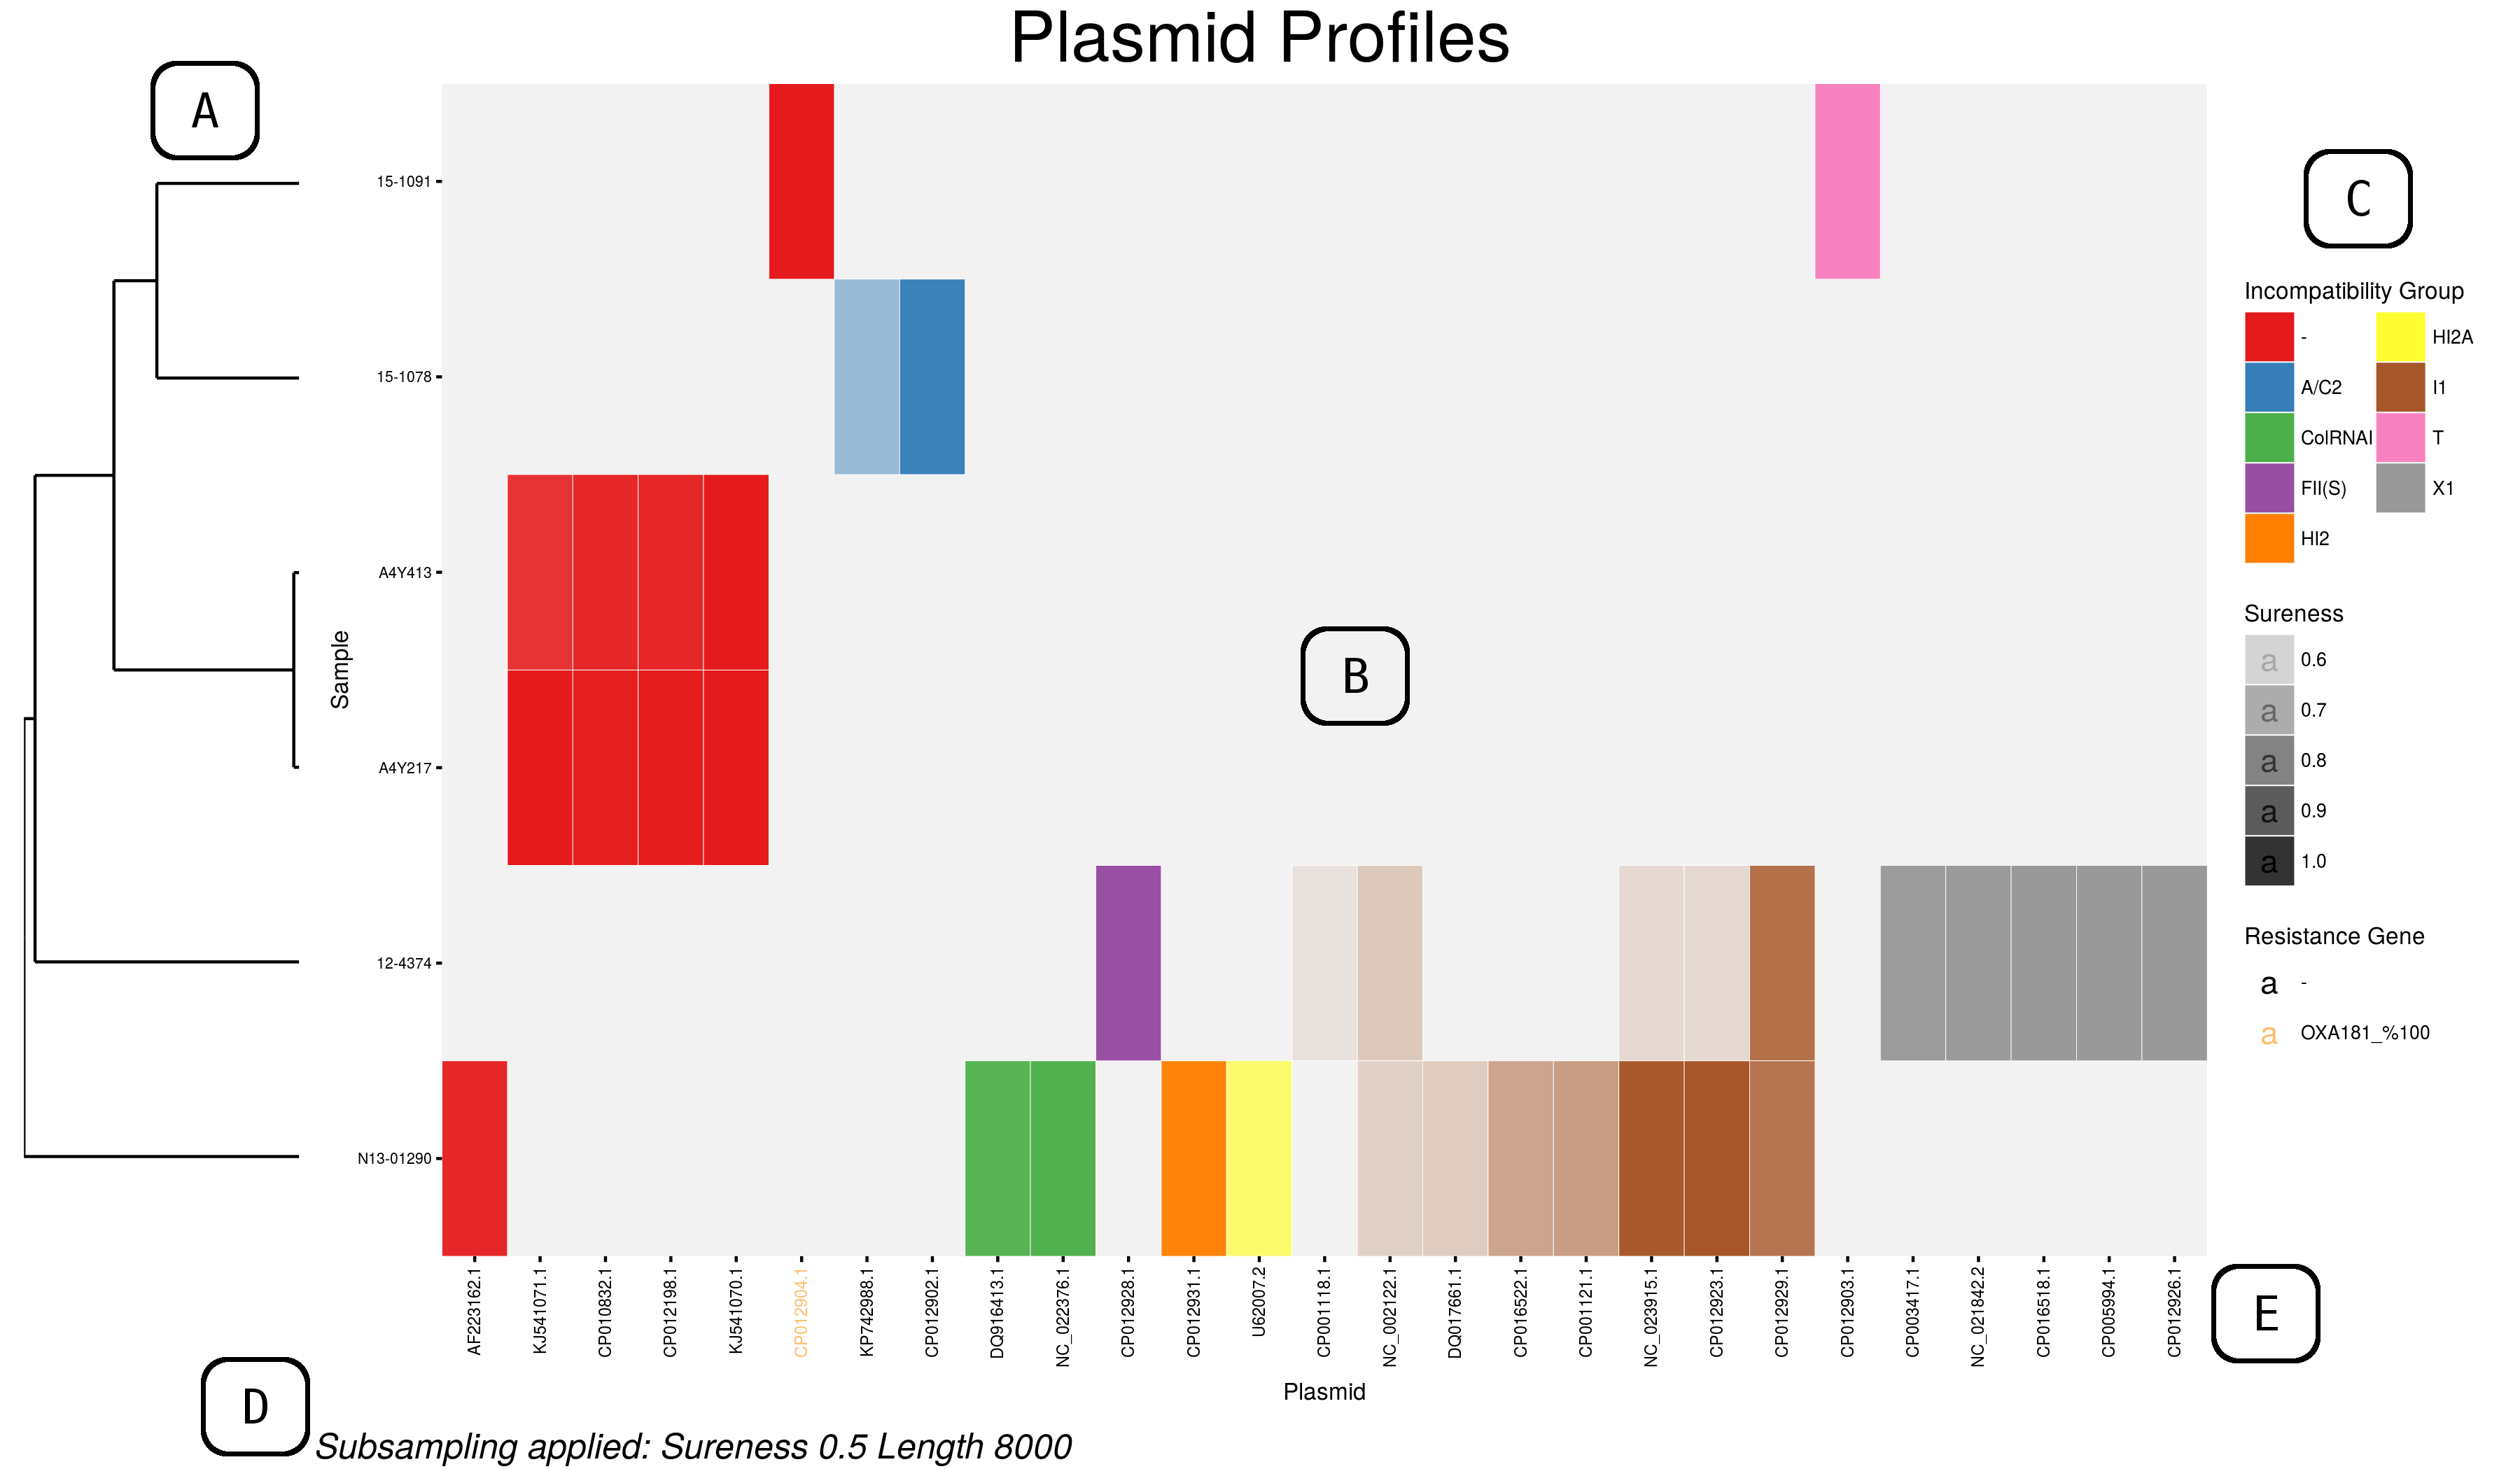
Static Heat Map
Example PNG output of the plasmid profiler. A number of different sections are described below:
A) Dendrogram revealing plasmid content similarity between samples
B) Heatmap created using ggplot2's tile geometry where colour indicates incompatibility group membership and alpha value the Sureness score over a range from filter cut off to 1.
C) Legends for Sureness, incompatibility group colour guide, and resistance gene of interest colour and identity.
D) Any data filtering applied is noted here.
E) Plasmid names below the heatmap are coloured according to the best hit resistance gene of interest found within that plasmid.
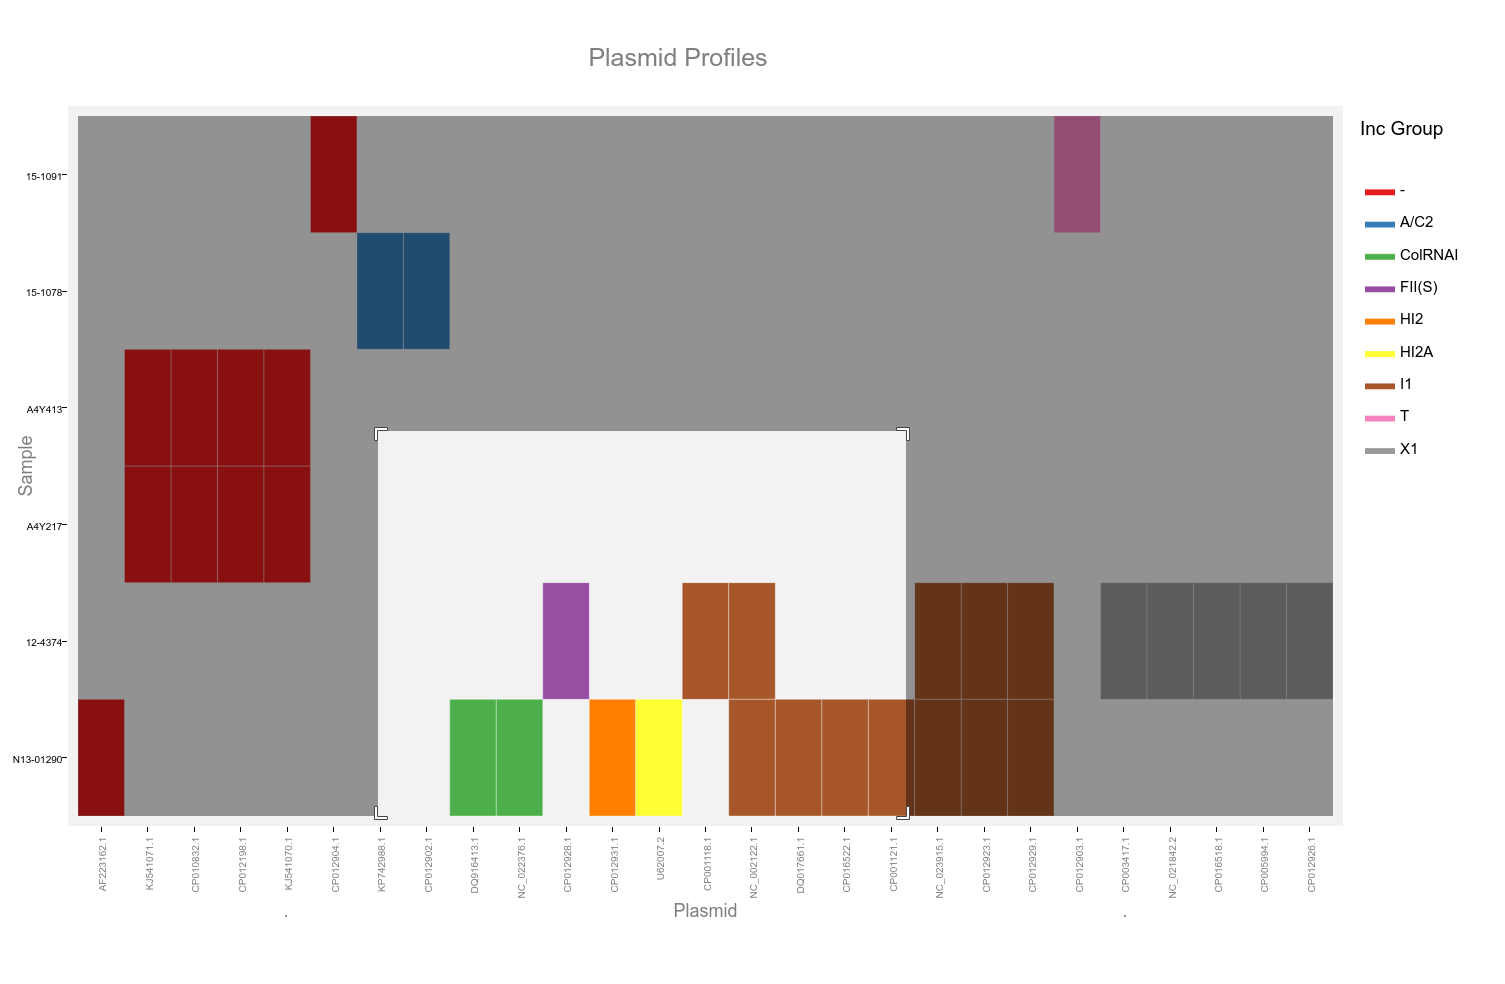
Interactive Heat Map
An example interactive heatmap can be found in the Plasmid Profiler GitHub.
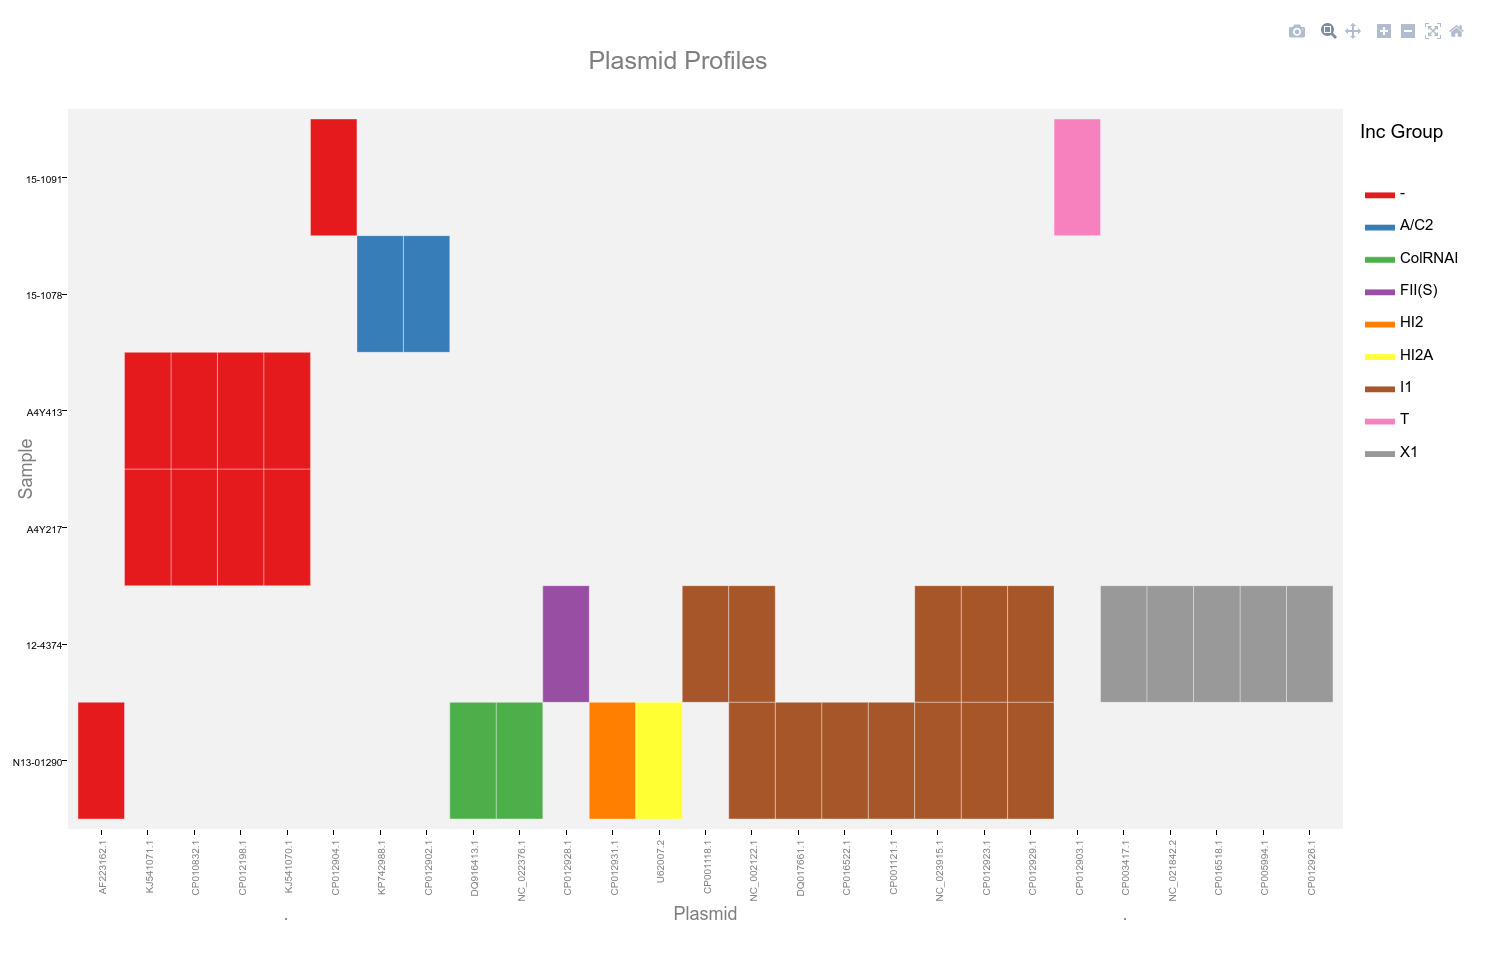
This heatmap is generated using the ggplotly function of plotly. It allows selection of a subset by dragging a selection over the desired plasmids as well as selection by incompatibility group.
Clicking on the camera icon at the upper right will save the current plot as a '.png' file.
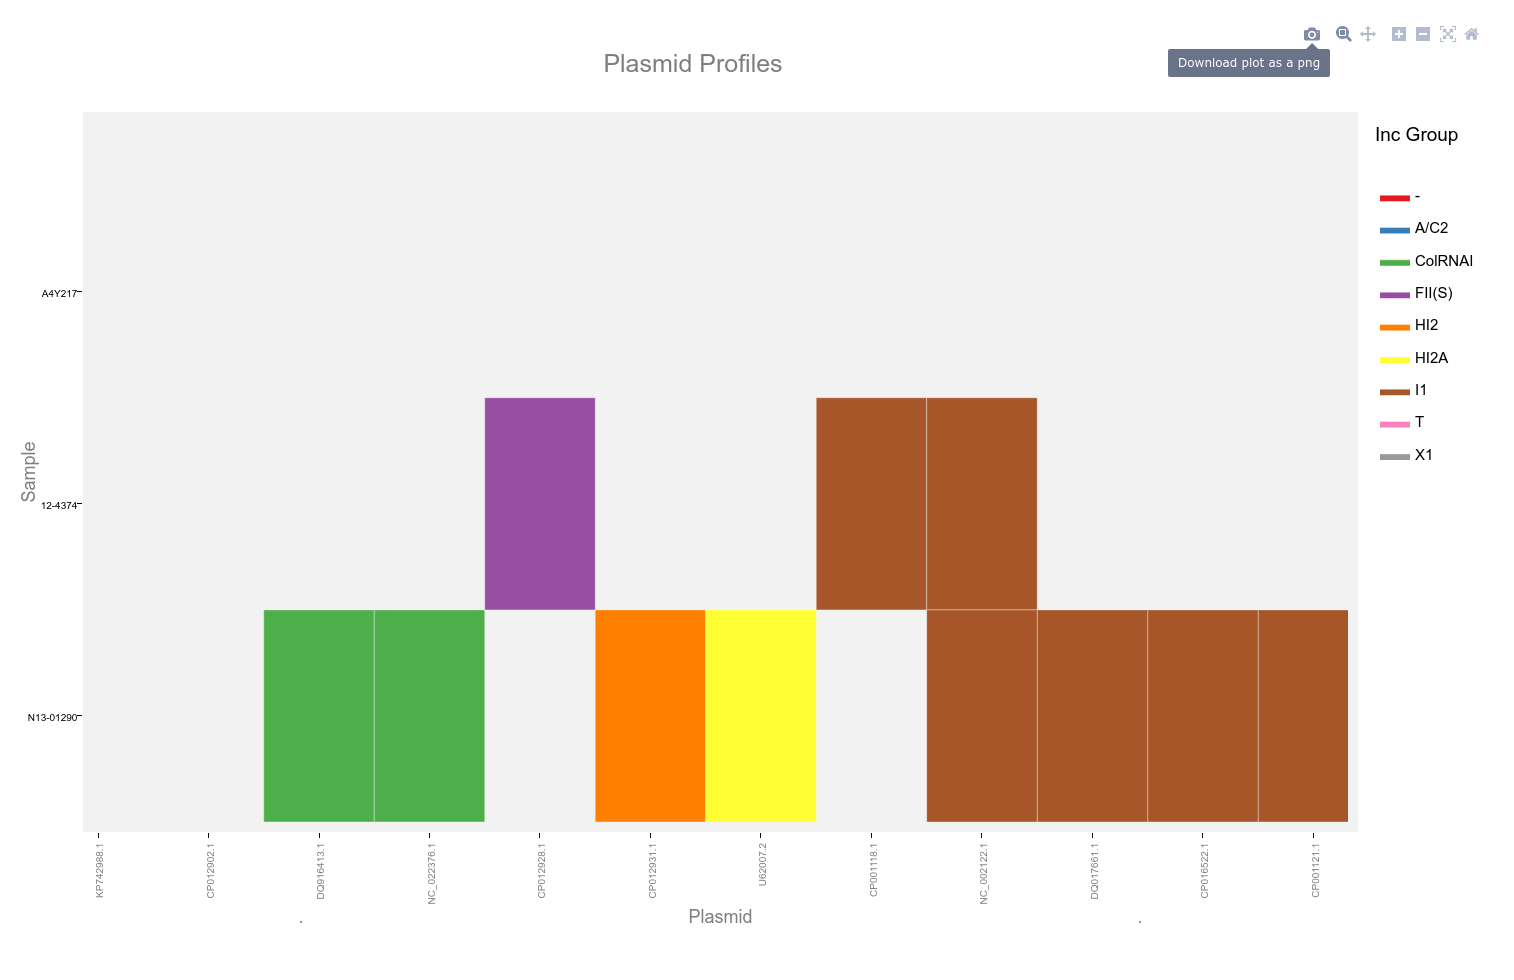
Double click the plot area to reset the view. Hovering the mouse cursor over the coloured blocks of the heatmap will reveal a popup with details of that plasmid and sample.
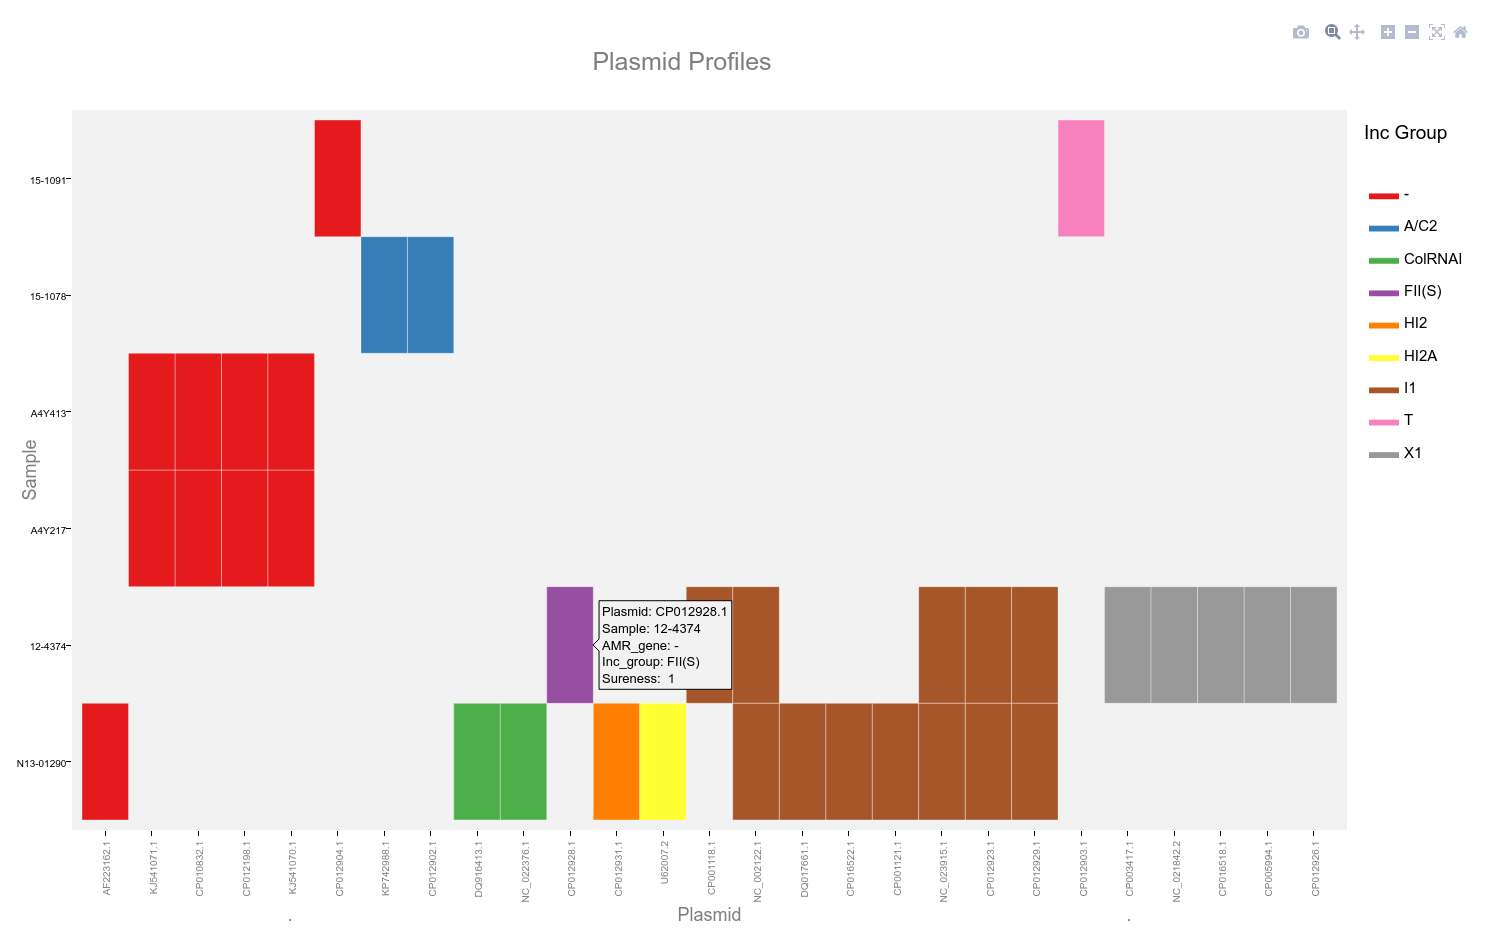
Current functionality of the interactive plot restricts the use of alpha values to indicate sureness and coloration of plasmid names to indicate presence of the genes of interest. These can be observed in the popups for each plasmid.
Comma Separated Value Table of Results
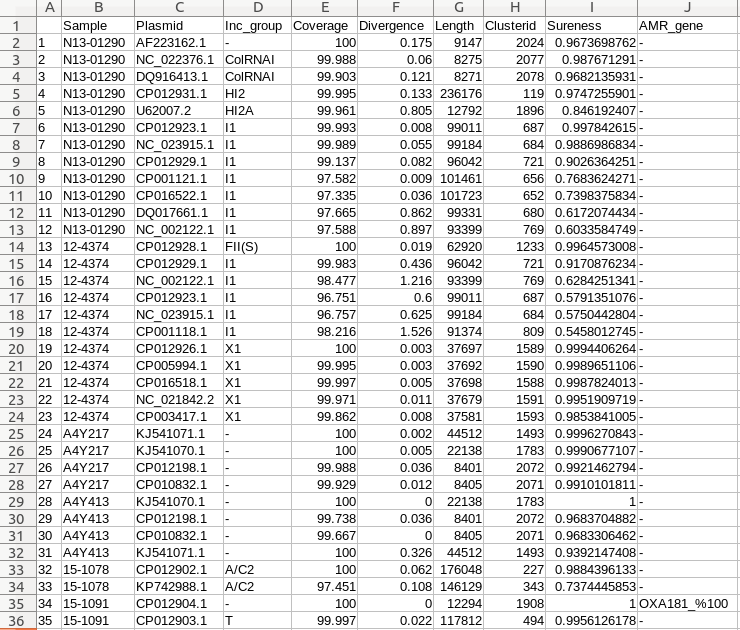
A comma separated table of values is also exported from the Plasmid Profiler pipeline. This contains all identified plasmids sorted by sample with the following information about each. The columns are as follows:
- Incompatibility Group: Plasmid replicon identified from Plasmid Finder Database. '-' if no match.
- Plasmid Coverage: Percentage of the plasmid covered by reads to minimum depth as measured by SRST2.
- Sequence Divergence: Sequence divergence from the reference plasmid over the covered area at minimum depth as measured by SRST2.
- Length: Length of the plasmid.
- Cluster ID: Cluster ID from CD-HIT.
- Sureness Value: Normalized difference between plasmid coverage and sequence divergence.
- Gene of Interest: Gene of interest identified with appended BLAST PID.